The Ultimate AUD Guide to Economics
The Ultimate CPA Guide to Economics
AUD exam review: business cycles, supply & demand, elasticity, inflation, and indicators
Economics is one of those AUD topics candidates often underestimate — and then lose easy points on. The exam expects you to understand how the macro-environment affects an entity’s inherent risk, which means knowing business cycles, economic indicators, inflation, supply and demand, and elasticity.
This guide consolidates the full topic into one place, with the concepts framed the way they actually matter on AUD: not just memorization, but what they imply for audit risk and planning.
Who this guide is for:
- AUD students who need one clear economics review page
- Students who want to connect economics to inherent risk
- Anyone struggling with indicators, business cycles, or elasticity signs
- Students looking for a final AUD economics cheat-sheet style review
Jump to:
Want a full AUD study roadmap?
I built a free course covering the exact strategies that helped me score 90+ on all four CPA exams, including AUD.
Get My Free CPA 101 CourseHow Does the AUD Exam Test Economics? AUD
Economics appears in Area II: Assessing Risk and Developing a Planned Response, under understanding the entity and its environment. The blueprint is fairly specific about what you need to know.
| Topic | Representative Task | Skill Level |
|---|---|---|
| Supply, Demand & Profit Maximization | Understand supply and demand, elasticity, and profit-maximization concepts | Remembering & Understanding |
| Business Cycles & Economic Indicators | Understand cycles and classify leading, coincident, and lagging indicators | Remembering & Understanding |
| External Factors & Inherent Risk | Identify economic and environmental factors that affect operations and risk of material misstatement | Application |
What this means for your exam prep
- Business cycles and indicators are mostly vocabulary + classification at the remembering/understanding level
- Supply, demand, and elasticity are mostly rules, curve logic, and sign interpretation
- The application layer is where AUD gets interesting: what does the economic environment imply for inherent risk?
Economic Business Cycles AUD High-Yield
The health of the economy is commonly measured by GDP, and GDP moves in a recurring pattern over time. Knowing where the economy sits in the cycle helps you think through how a client’s risks may change.
| Stage | Also Called | What Is Happening |
|---|---|---|
| Trough | Bottom | The lowest point of economic output before recovery begins |
| Expansionary | Recovery | Economic output is increasing from trough toward peak |
| Peak | Top | The highest point of economic output before downturn begins |
| Contractionary | Recession | Economic output is decreasing from peak toward trough; a severe recession is a depression |
Study Tip: The four parts of the business cycle are trough, expansion, peak, and contraction.
Kyle’s 90+ Score Insight: On AUD, these terms matter because they affect risk. In a contractionary phase, management pressure rises, receivable collectability may weaken, inventory may be overstated, and going concern becomes more relevant. Always ask: what does this economic condition imply for the audit?
Economic Indicators AUD High-Yield
| Type | When It Signals | Purpose | Examples |
|---|---|---|---|
| Leading | Before the change | Predict future direction | Building permits, stock market returns, new manufacturing orders, consumer confidence |
| Coincident | At the same time | Measure current conditions | GDP, personal income, retail sales, industrial production |
| Lagging | After the change | Confirm past trends | Debt-to-income ratio, unemployment rate, CPI, prime lending rate |
Blueprint-specific indicators to know
These are especially worth knowing because the blueprint effectively names them.
| Indicator | What It Measures | Type |
|---|---|---|
| Consumer Price Index (CPI) | Tracks price changes for consumer goods and services; main measure of inflation | Lagging |
| Producer Price Index (PPI) | Tracks price changes from the seller’s perspective | Leading |
| Federal Funds Rate | Rate banks charge each other overnight; core monetary policy tool | Leading |
| Bond Yields | Return on bonds; can reflect inflation expectations and credit tightening | Leading |
| Unemployment Rate | Percent of labor force unemployed and seeking work | Lagging |
Study Tip: Leading predicts the future. Coincident describes the present. Lagging confirms the past.
Common Trap: Students often assume unemployment is leading because it feels important. On the exam, unemployment is generally treated as a lagging indicator.
Inflation AUD
Inflation is usually measured by the Consumer Price Index (CPI). If inflation becomes extreme and rapid, it is referred to as hyperinflation.
| Term | Definition |
|---|---|
| Inflation | Rising prices over time; purchasing power decreases |
| Hyperinflation | An extreme and rapid rate of inflation |
| Consumer Price Index (CPI) | The main index used to measure inflation |
Study Tip: Inflation is measured by CPI. Rising inflation means a dollar buys less over time.
Connecting economics to audit risk is a skill, not just memorization.
My Free CPA 101 Course walks through how I approached AUD to score 90+ and shows you how to think like an auditor on exam day. Check it out here.
Supply and Demand AUD High-Yield
The Law of Demand
Demand reflects the buyer’s side. As price rises, quantity demanded falls. As price falls, quantity demanded rises. The demand curve slopes downward.
An important distinction: a change in quantity demanded is movement along the demand curve caused by price. A change in demand is a shift of the whole curve caused by non-price factors.
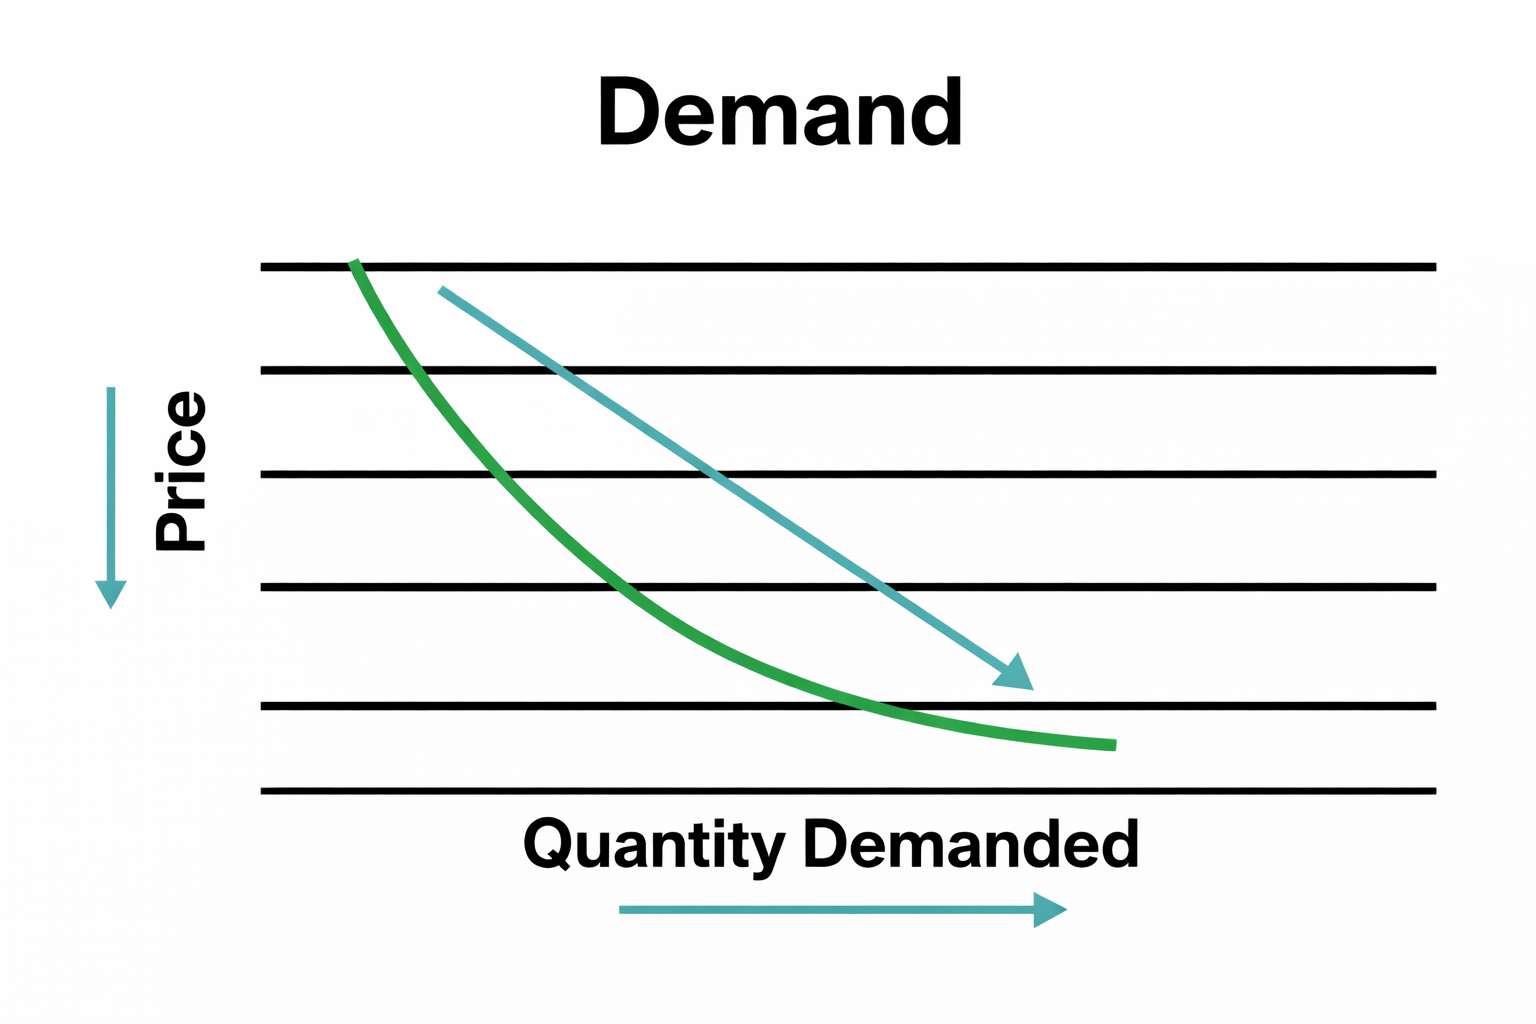
Study Tip: Demand is inverse: as price increases, quantity demanded decreases.
The Law of Supply
Supply reflects the seller’s side. As price rises, quantity supplied rises. As price falls, quantity supplied falls. The supply curve slopes upward.
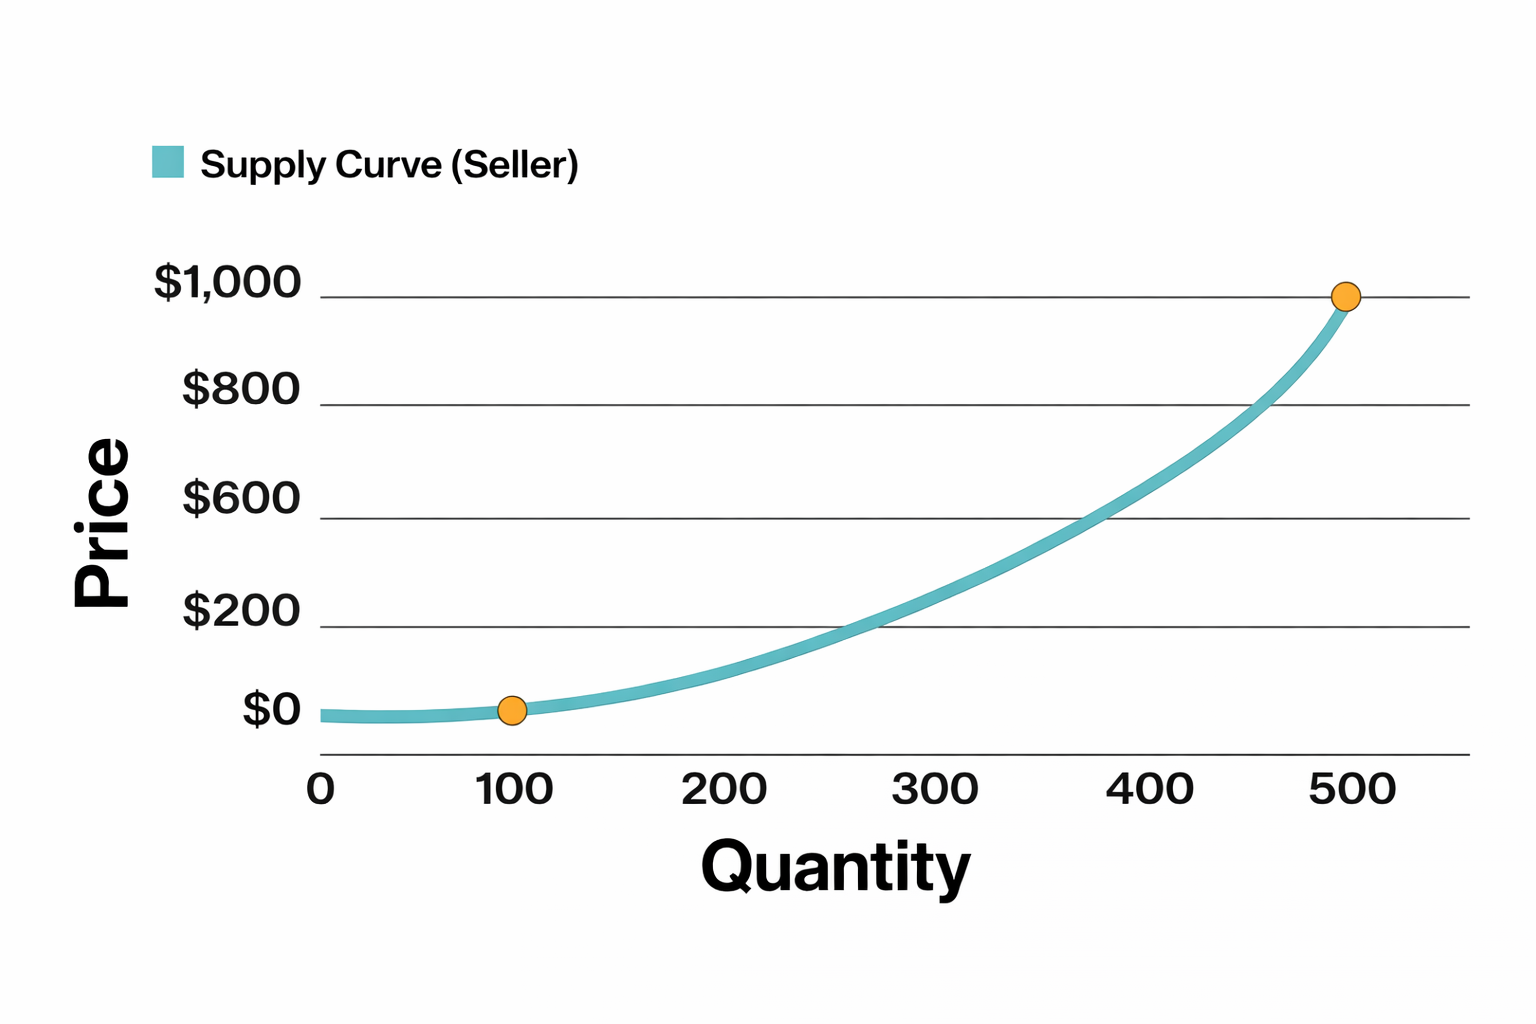
Study Tip: Supply is positive: as price increases, quantity supplied increases.
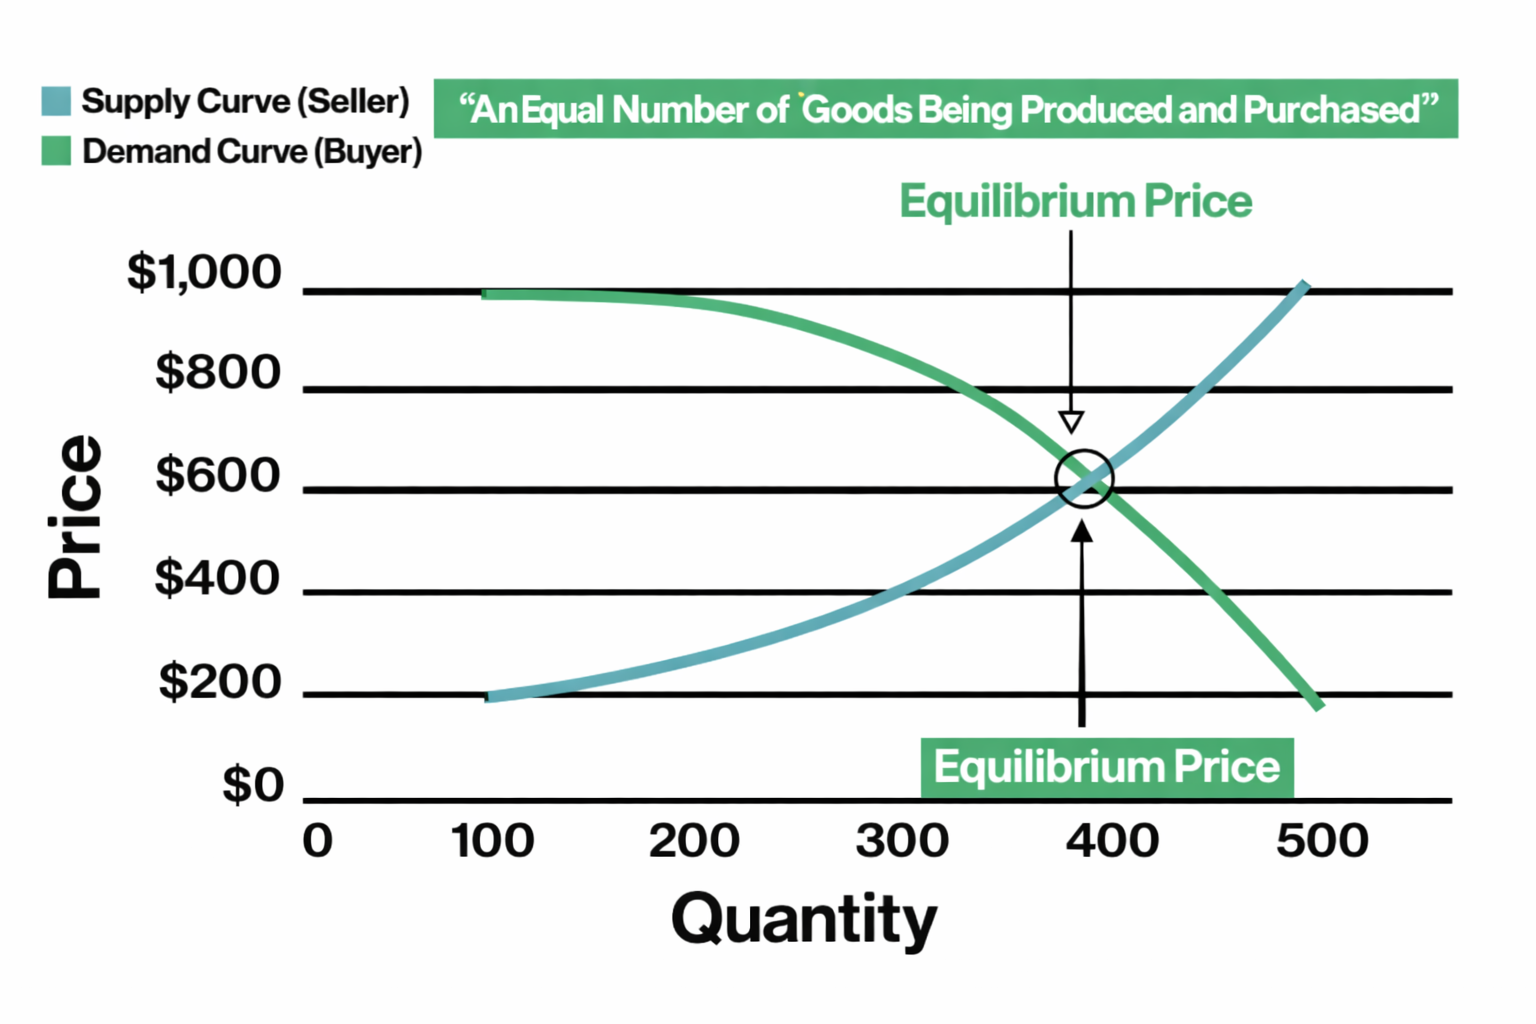
The Equilibrium Point
Equilibrium is the point where quantity supplied equals quantity demanded. At that price, there is no shortage and no surplus.
What causes the demand curve to shift?
| Cause | Effect on Demand Curve |
|---|---|
| Competitor lowers price of a substitute | Demand decreases (shifts left) |
| Price of a complementary good decreases | Demand increases (shifts right) |
| Consumers expect a future price increase | Demand increases (shifts right) |
| Income increases | Demand increases (shifts right) |
| Customer base expands | Demand increases (shifts right) |
What causes the supply curve to shift?
| Cause | Effect on Supply Curve |
|---|---|
| Production costs decrease | Supply increases (shifts right) |
| Government subsidies increase | Supply increases (shifts right) |
| Enhanced technology | Supply increases (shifts right) |
| Taxes increase | Supply decreases (shifts left) |
Kyle’s 90+ Score Insight: The most common exam mistake here is mixing up movement along a curve with shifting the whole curve. If the question changes price, move along the same curve. If it changes income, substitute prices, expectations, taxes, technology, or subsidies, shift the whole curve.
Elasticity AUD High-Yield
There are three main elasticity ideas tested around this topic area.
| Type | What It Compares | What It Determines |
|---|---|---|
| Price Elasticity of Demand | One product: price change vs. quantity demanded | Whether demand is elastic or inelastic |
| Income Elasticity of Demand | One product: income change vs. quantity demanded | Whether the good is normal or inferior |
| Cross-Elasticity of Demand | Two products: price of A vs. quantity demanded of B | Whether goods are substitutes or complements |
Income Elasticity of Demand
Income elasticity helps determine whether a good is normal or inferior.
| Result | Good Type | What It Means | Example |
|---|---|---|---|
| Positive (+) | Normal Good | As income rises, demand rises | Higher-end restaurants |
| Negative (−) | Inferior Good | As income rises, demand falls | Fast food or lower-tier substitutes |
Study Tip: Positive income elasticity = normal good. Negative income elasticity = inferior good.
Cross-Elasticity of Demand
Cross-elasticity compares two products to determine whether they are substitutes or complements.
| Result | Relationship | Logic | Example |
|---|---|---|---|
| Positive (+) | Substitute Goods | Price of A rises, demand for B rises | Competing phone brands |
| Negative (−) | Complementary Goods | Price of A rises, demand for B falls | Hamburgers and buns |
Study Tip: Positive cross-elasticity = substitutes. Negative cross-elasticity = complements.
Kyle’s 90+ Score Insight: The easiest way to keep elasticity straight is this: positive means the two things move in the same direction, and negative means they move in opposite directions. That one sign rule solves a lot of elasticity questions.
Quick Reference Glossary
Use this for fast final review before exam day.
| Term | One-Line Definition |
|---|---|
| GDP | Gross Domestic Product; total economic output |
| Trough | The lowest point in the business cycle |
| Peak | The highest point in the business cycle |
| Expansionary Phase | Economic output is increasing |
| Contractionary Phase | Economic output is decreasing |
| Depression | A severe and prolonged recession |
| Leading Indicator | Signals change before it happens |
| Coincident Indicator | Moves with the economy in real time |
| Lagging Indicator | Confirms change after it happens |
| CPI | Main measure of inflation |
| PPI | Measures price changes from the producer side |
| Inflation | Sustained increase in prices over time |
| Hyperinflation | Extreme, rapid inflation |
| Law of Demand | As price rises, quantity demanded falls |
| Law of Supply | As price rises, quantity supplied rises |
| Equilibrium Price | Price where quantity supplied equals quantity demanded |
| Change in Quantity Demanded | Movement along the demand curve caused by price |
| Change in Demand | Shift of the whole demand curve caused by non-price factors |
| Substitute Goods | Goods that can replace each other; positive cross-elasticity |
| Complementary Goods | Goods bought together; negative cross-elasticity |
| Normal Good | Demand rises as income rises |
| Inferior Good | Demand falls as income rises |
| Income Elasticity | % change in quantity demanded divided by % change in income |
| Cross-Elasticity | % change in quantity demanded of B divided by % change in price of A |
FAQ
Why does economics matter on AUD?
Because the auditor must understand the client’s environment and assess how economic conditions affect inherent risk, operations, and financial reporting pressure.
What is the easiest way to remember leading, coincident, and lagging indicators?
Leading predicts the future, coincident describes the present, and lagging confirms the past.
What is the difference between a change in quantity demanded and a change in demand?
A change in quantity demanded is movement along the demand curve caused by price. A change in demand is a shift of the whole curve caused by non-price factors.
How do I know whether a good is normal or inferior?
Use income elasticity. Positive means normal good. Negative means inferior good.
How do I know whether goods are substitutes or complements?
Use cross-elasticity. Positive means substitutes. Negative means complements.
Ready to connect economics to the full AUD picture?
Understanding the macro-environment is just one piece of how auditors assess risk. My Free CPA 101 Course gives you a complete roadmap for studying AUD smarter and passing the first time.
Kyle Ashcraft is a CPA who scored a 90+ on all four CPA exams. Kyle founded Maxwell CPA Review, which is an exam-prep company that offers a comprehensive CPA exam review course and private tutoring.
Explore More Comprehensive CPA Guides
Master operating and finance leases, journal entries, and amortization schedules.
The ultimate cheat sheet for turnover, liquidity, and profitability ratios.
Break down variance analysis, job costing, and activity-based costing (ABC).
Understand NPV, IRR, payback period calculations, and investment decisions.
Simplify macro and microeconomic concepts, supply, demand, and market structures.
Navigate relational databases, IT governance, segregation of duties, and cybersecurity.